Admin SDKs
The SDKs tab shows what is actually connecting to your account: which SDK versions are in the wild, which of your applications the traffic comes from, and which client IPs send the most of it. Use it to find instances stuck on an old SDK version, to see which workloads a flag change will reach, and to explain where your SDK request volume comes from.
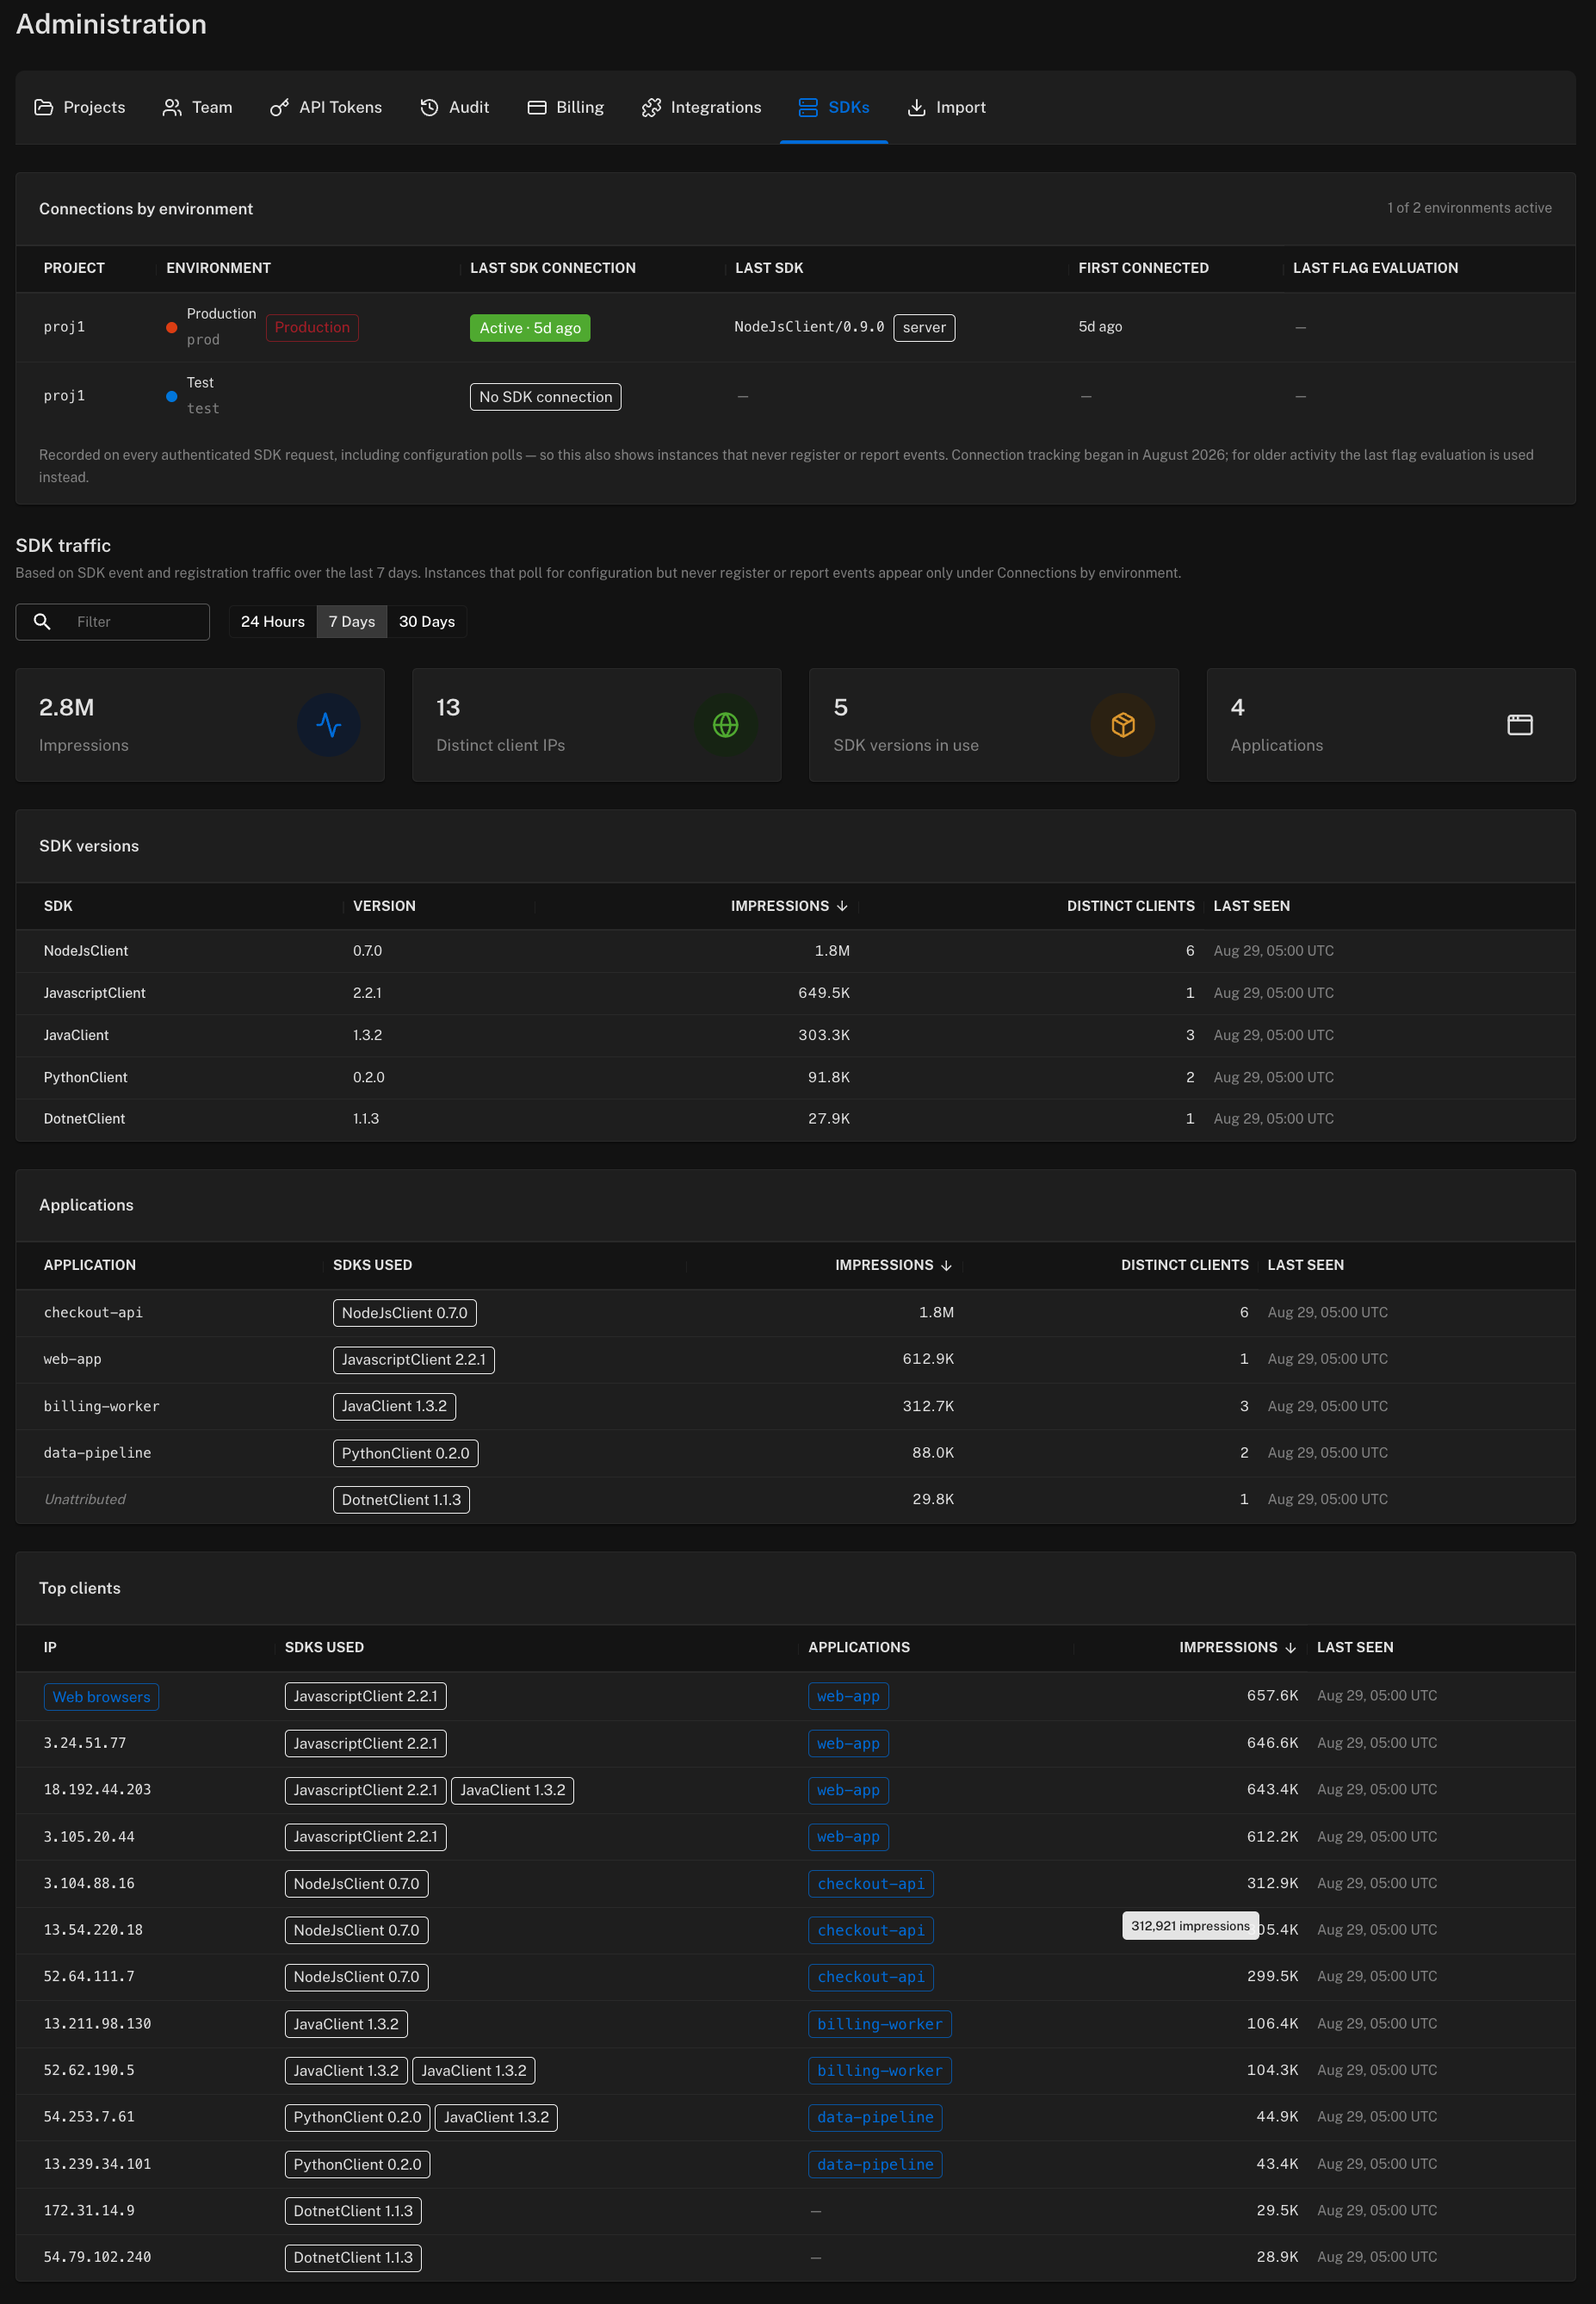
Connections by environment
The first card answers the most basic question — which environments are SDKs actually talking to? — with one row per environment across all your projects, most recently contacted first:
- Last SDK connection — Active (contacted within 7 days), Idle (within 90 days), Inactive (older) or No SDK connection, with the age of the newest evidence.
- Last SDK — the identifier the last SDK sent (for example
NodeJsClient/0.9.0) and whether it authenticated with a server key (secret, sent in a header) or a client key (public, sent in the URL). - First connected and Last flag evaluation — when the environment was first contacted, and when a flag was last evaluated in it.
Unlike the tables below, this card is recorded on every authenticated SDK request, including configuration polls, so an instance that never registers or reports events still shows up here. Connection tracking began in August 2026; for older activity the last flag evaluation is used instead. The same verdict appears on each project's Environments tab and in the delete-environment dialog — see Is anything still using this environment?.
SDK traffic at a glance
Below the connections card, four summary tiles give the headline figures for the selected window — Flag impressions reported, Distinct client IPs, SDK versions in use and Applications sending an application name — followed by one card each for SDK versions, applications and top clients.
Impressions are flag evaluations your SDKs report in their events. They are not the SDK requests counted on the Billing page, which are HTTP calls to Featureflow (configuration polls, client evaluations, events and registrations). A server SDK evaluates flags in memory and only polls for configuration, so its impressions and its requests bear no fixed relationship — the two totals are not meant to match.
Time window and filter
The 24 hours / 7 days / 30 days / This month toggle sets the window for everything on the page; it defaults to 7 days. This month is the calendar month to date (UTC), the same window as the "SDK requests this month" card on Billing. The filter box narrows all three tables at once — it matches SDK names, versions, application names and IPs.
The header shows the number of distinct client IPs seen in the window. IPs are NAT/egress addresses, so one IP can hide many instances behind it.
SDK versions
One row per SDK and version, with impressions, distinct clients and when it was last seen. This is the table to check before relying on a recent SDK feature: an old version still appearing here means an instance somewhere has not been upgraded.
Applications
Usage broken down by application tag: each application's impressions, distinct clients, the SDKs it runs, and when it was last seen.
Traffic from SDK instances that do not send an application name is collected into an
Unattributed row, which always sorts last — it is the leftover bucket, not a workload. To
attribute it, set application in the SDK configuration of whatever is sending it; Application
Tags has the one-line config for every SDK. Until at least one instance
sends a name, the table is replaced by a hint telling you the same thing.
Top clients
The highest-traffic client IPs, with the SDKs and applications seen behind each one. Browser SDK traffic is aggregated into a single Web browsers row rather than tracked per visitor IP. When there are more client IPs than the table shows, a note gives the total and the table holds the top ones by impressions.
Where the data comes from
The view is based on SDK event and registration traffic over the selected window. Instances that poll for configuration but never register or report events are not shown — an SDK with events disabled does not appear here, even though it is serving flags — use Connections by environment to see those. Last seen times are hourly and in UTC, because the underlying data is bucketed by hour.
Per-flag attribution
The same application data powers the Evaluated by card on each feature's Statistics tab, which lists the applications that evaluated that specific flag — the thing to check before archiving it.