Grafana Integration
"Latency spiked at 14:32 — what changed?" Very often the answer is a feature flag. The Grafana integration posts every flag change to your Grafana as an annotation, so the change shows up as a marker on the dashboard you are already looking at.
Before you start
You need:
- A Grafana Cloud stack or a self-hosted Grafana reachable over HTTPS. Featureflow makes the
call from its servers, so
http://URLs and private addresses (localhost,10.x,192.168.x) are rejected. To test against a local Grafana, put it behind an HTTPS tunnel. - The Organisation Admin role in Featureflow.
1. Create a service account in Grafana
In Grafana, go to Administration → Users and access → Service accounts.
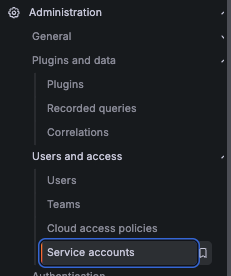
Click Add service account.

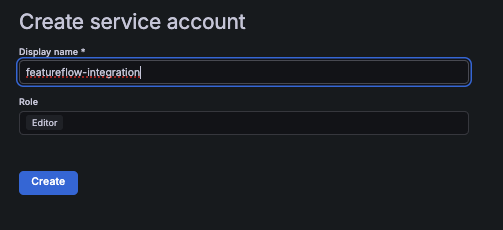
Give it a name — featureflow-integration is a good one — and set the role to Editor, which
is what allows it to write annotations. Click Create.
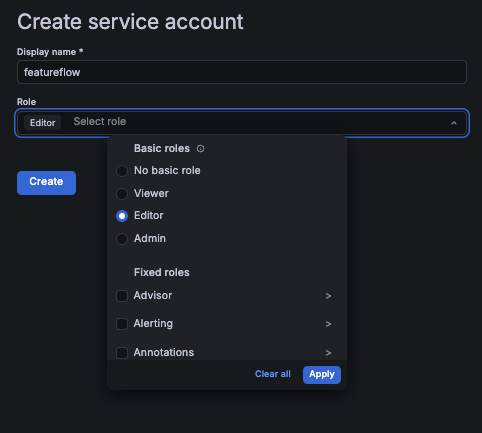
The role picker also lists Fixed roles. If you would rather not grant full Editor, clear the basic role and expand Annotations instead — Featureflow only ever writes annotations, so that is all the token needs.
2. Generate a token
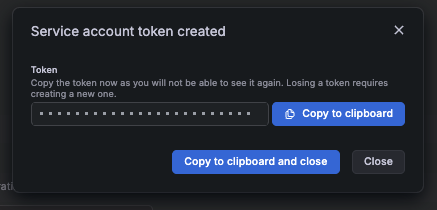
Creating the service account does not give you a token — that is a separate step. On the service account page, click Add service account token.

Accept the generated name (or set your own), leave the expiration as No expiration unless your policy requires rotation, and click Generate token.
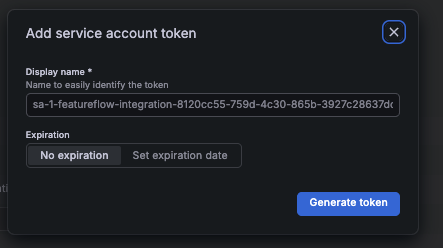
Copy the token now — Grafana will not show it again. Losing it means creating a new one.
3. Add the destination in Featureflow
Go to Administration → Integrations, find the Grafana card (the search box filters the catalogue), and click Add Grafana.
| Field | What to enter |
|---|---|
| Service account token | The token you just copied. It is stored write-only: it is never shown again, and editing the destination without re-entering it keeps the stored one. |
| Grafana URL | Your stack or instance URL, e.g. https://yourorg.grafana.net. No path — a trailing slash is fine. |
| Dashboard UID | Optional. Leave blank so annotations are organisation-wide and can appear on any dashboard (recommended). Set it to pin annotations to one dashboard. |
| Send changes from | The environments to send. Leave empty for all of them; most teams pick production only, so a developer toggling flags in dev does not annotate the ops dashboard. |
| Enabled | Whether changes are sent. Turn it off to pause the destination without deleting it. |
Save, then click the send icon on the destination to deliver a test event. A green confirmation means the token, URL and permissions all work; a failure shows the reason (401 is the token, 403 is permissions, 404 is the URL).
You can add more than one Grafana destination — for example, one per stack.
4. Show the annotations on a dashboard
Organisation-wide annotations do not appear on a dashboard until that dashboard asks for them. This is the step most people miss.
In the dashboard, open Dashboard settings → Annotations → New query, then:
- Set the data source to -- Grafana --.
- Set Filter by to Tags.
- Add the tag
source:featureflow. - Save the dashboard.
Flag changes now appear as vertical markers on the time axis. Hover one to see what changed, who changed it, and a link back to the flag in Featureflow.
Tags you can filter on
Every annotation carries these, so you can scope a dashboard to exactly the changes it cares about:
| Tag | Example | Notes |
|---|---|---|
source:featureflow | source:featureflow | On every annotation. |
feature:<key> | feature:checkout-v2 | |
project:<key> | project:web | |
environment:<key> | environment:production | The friendly key. Not unique across projects. |
env:<projectKey>:<key> | env:web:production | Fully qualified — use this when two projects both have a production. |
change:<type> | change:updated | created, updated or deleted. |
What gets sent
Feature flag changes — targeting rule and on/off changes, and features being created or removed. Housekeeping such as description edits and API key rotations is deliberately not sent: a marker that fires for everything gets ignored.
Delivery happens after the change is saved and never affects it. If Grafana is unreachable, Featureflow retries once, records why on the destination, and moves on — your flag change is unaffected either way.
Troubleshooting
The test event says it was delivered, but nothing appears on my dashboard. The dashboard needs an annotation query (step 4). Confirm the annotations exist first:
curl -s -H "Authorization: Bearer <token>" \
  "https://yourorg.grafana.net/api/annotations?tags=source:featureflow&limit=5"
Real changes do not arrive, but the test event does. Test events ignore the environment filter by design. Check that the environments listed on the destination include the one you are changing flags in, and that the destination is Enabled.
401 or 403. The token is wrong, expired, or the service account lacks permission to write annotations. Recreate the token with the Editor role.
404. The URL is wrong. It should be the base URL only — https://yourorg.grafana.net, not a
dashboard or API path.